Working with Submitted Data in Aggregate
Warning
ODK Aggregate is no longer being updated. Please use ODK Central instead.
You can view the data submitted from ODK Collect here. You can filter the submissions, visualize them using pie chart, bar graph or map, export the submissions into useful formats and publish the submitted data into another service. You can also view all the exported submissions. ODK Aggregate provides all these options under the Submissions tab.
Filtering Submissions
Submissions from ODK collect can be filtered to view or hide a specific subset of data by creation of filters. Filters give you the ability to see a subset of your data. You can have a single filter as well as multiple filters. If you have multiple filters applied at once, then you have a filter group. You can create and apply filters by using the options under the Filter Submissions tab.
You can create a single or multiple filters depending on the subset of data you want to view or hide. Creating a filter like Display Rows where column Gender EQUAL male specifies that you want to get a list of all rows where gender column has value as male i.e you want to obtain information about all male people in your data. Unless the filter is saved, it is temporary. You can save a filter to make it permanent. Any filter can be deleted if it is no longer needed.
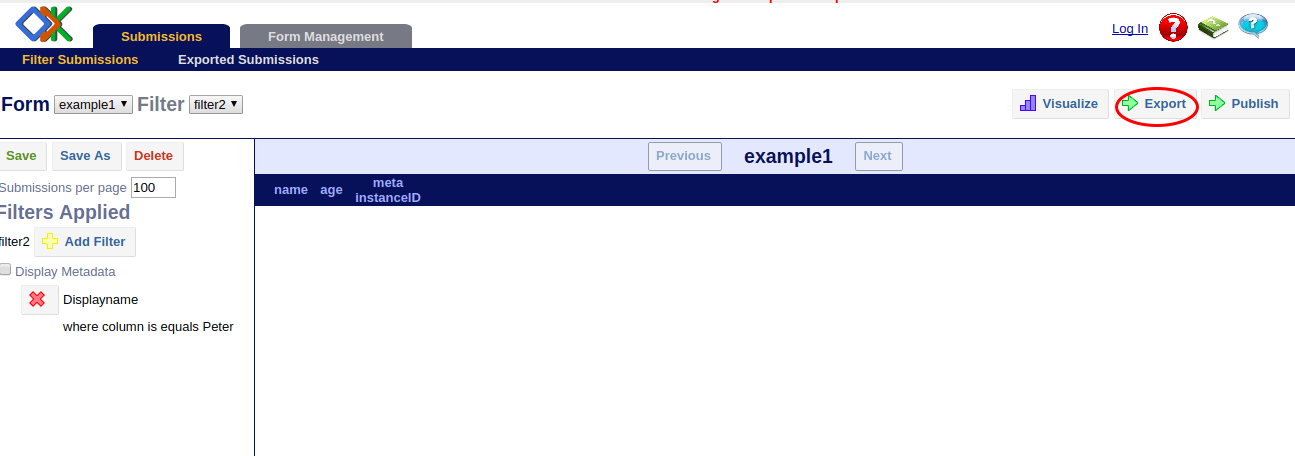
Various options under this tab can be used as follows:
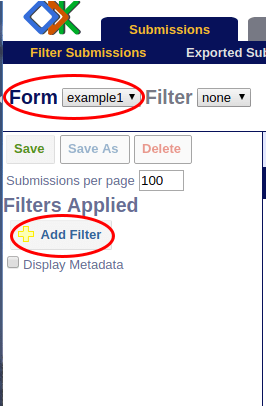
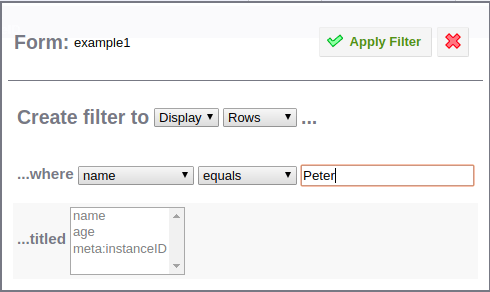
Click on Add Filter to add filter to the data. In the Create filter to dropdown, or will specify whether you will be selecting data to show or hide and or will specify whether you will be working with the rows or columns of the table.
If you select specify a condition you want to apply in the where box.
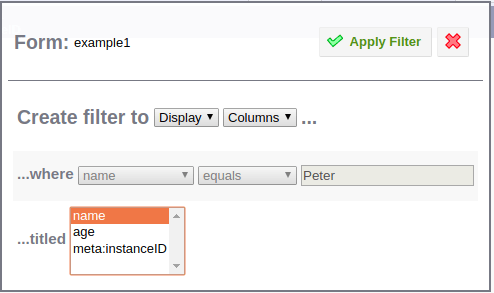
If you selected specify the columns you wish to display or hide in the titled box.
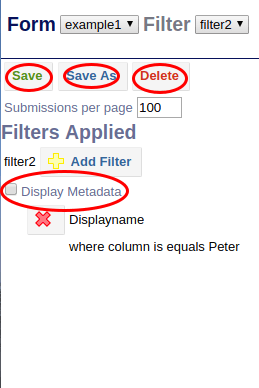
Click on Save to save the filter or filter group for future use. Clicking on Save As allows you to give a name to the filter or filter group.
Click on Delete to delete a filter or filter group.
You can check the Display Metadata checkbox to display or hide metadata.
Note
Metadata provides information about the submissions. There will be information such as date submitted, if the data is complete, version numbers, and id numbers.
Visualizing Submissions
ODK Aggregate provides a quick means for basic data visualization. This Visualize functionality is meant to provide a quick means to view early data results in meaningful ways but is not meant to provide complex data analysis functionality. You can view your data in bar graph, pie chart or on a map.
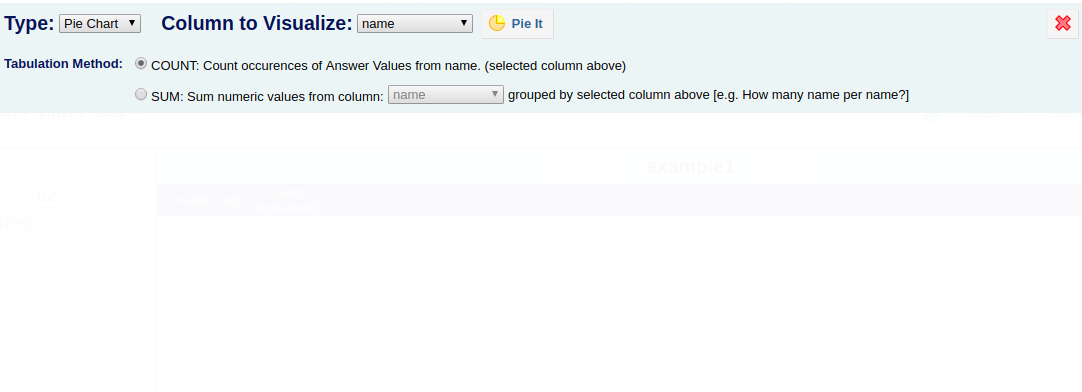
In both Pie chart and bar graph visualization you can either count the number of times a unique answer occurs in a specified column or calculate sum of values in one column grouped by a value in another column. You can choose a column that you want to map in map visualization.
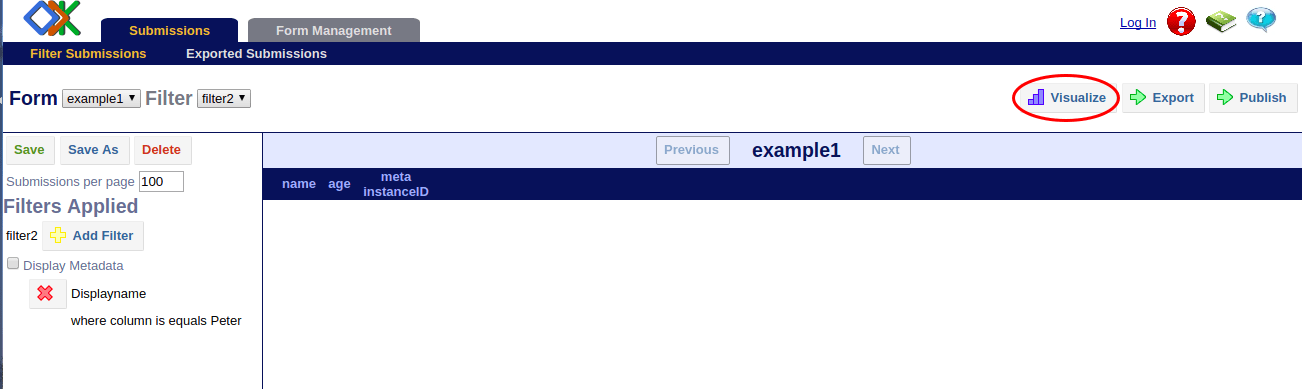
Click on Visualize to visualize the submitted data. Select bar graph, pie chart or map in the Type dropdown. Further options are described as follows:
If you choose Pie Chart, choose whether you would like to count or sum data:
If you select Count option, then select the column in which you want to apply this.
If you select Sum option, then select the column of values that you want to add and another column that you want to use to group the numbers.
Then click on Pie It to get the Pie Chart.
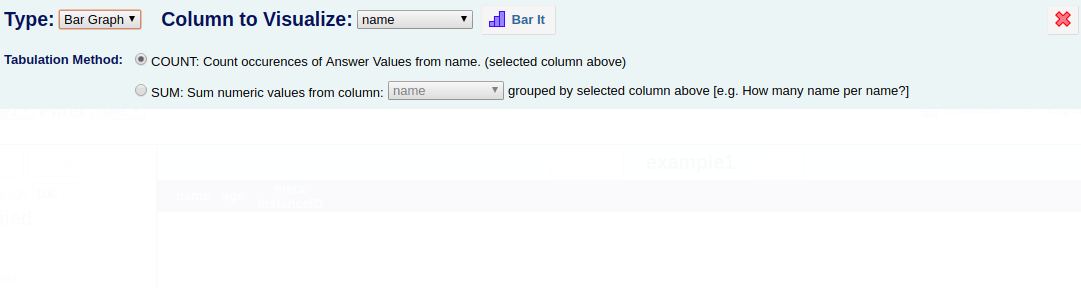
If you choose Bar Graph, you have the same options as that in case of Pie Chart. Choose the option you want to use and then click on Bar It to get the Bar Graph.
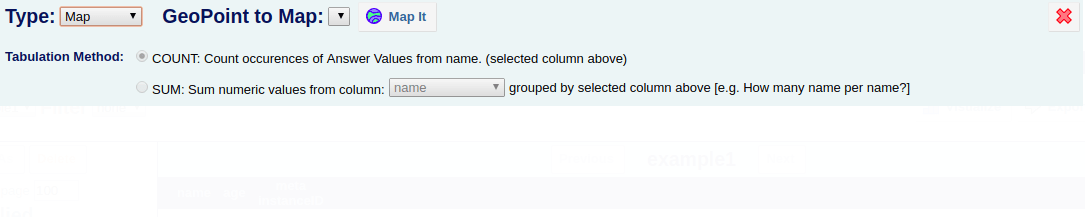
If you choose Map, select a column that you want to map in the GeoPoint to Map dropdown. Click on Map It to get the map. You can click on a point to view a balloon with the other information supplied in the table.
Exporting Submissions
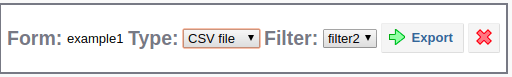
Click on Export option to export submitted data into useful formats and choose the format in which you want to export data. You can also choose a filter which you have saved earlier to export only a certain subset of data. Details on exporting data are given in the data transfer section.
Publishing Submissions
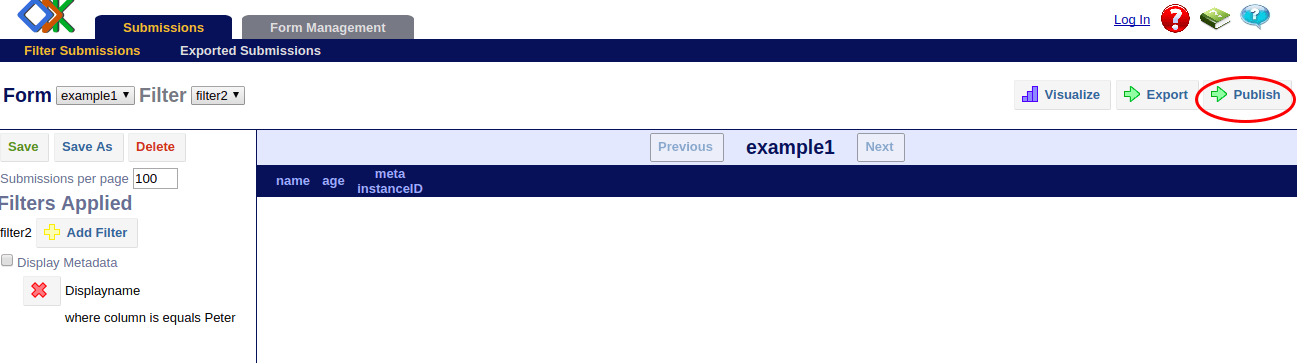
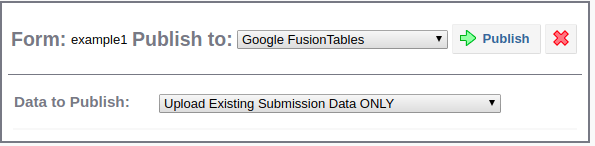
Click on Publish option to publish the submitted data into another service. You can choose where you want to publish data and which data you want to publish. Details on publishing data are given in the data transfer section.
Viewing Exported Submissions
You can to view the list of exported files under the Exported Submissions tab.
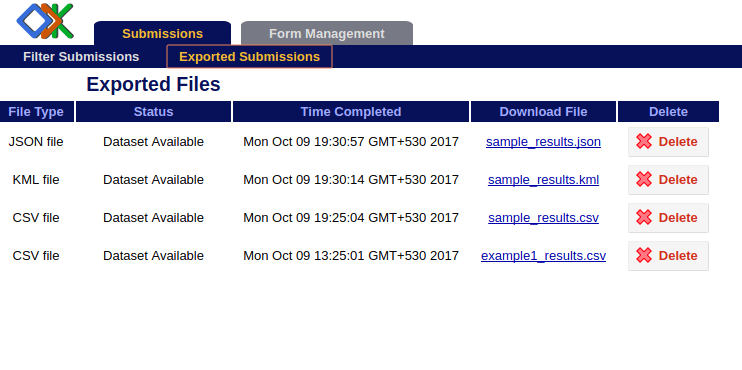
File Type specifies whether file is
.csvor.kmlor.jsonfile.Status will state whether the file being made is in progress, or is now available for viewing.
Time Completed shows the time when the Export task is complete and the file is ready.
Click on the link in Download File to see your exported file.
Select delete box in the Delete column if you want to delete your exported file.