Power BI tutorial: Mapping households
When surveying households, you may want to map each submission to visualize progress. In this tutorial, you'll learn to connect Power BI to ODK Central to build a map of households that can be refreshed as new submissions arrive.
Tip
See easily connect ODK to Power BI for a video using Power BI with ODK.
See connecting Excel to ODK for instructions on using Excel with ODK.
Power BI and Excel uses the same underlying technology (Power Query) to connect to Central's OData feed. Try both of the above resources to maximize your learning.
Goals
Connect Power BI to ODK
Prepare data for mapping
Display data on the map
Collect data with locations
Warning
If you've never created an XLSForm before, complete the XLSForm Tutorial first.
Download this Household Survey as an .xlsx.
Upload the form into Central, publish it, connect your app user, and send in some sample data.
Connect Power BI to ODK
In Central, find your form's OData link by clicking on the Analyze via OData button on the right side of the Submissions page.
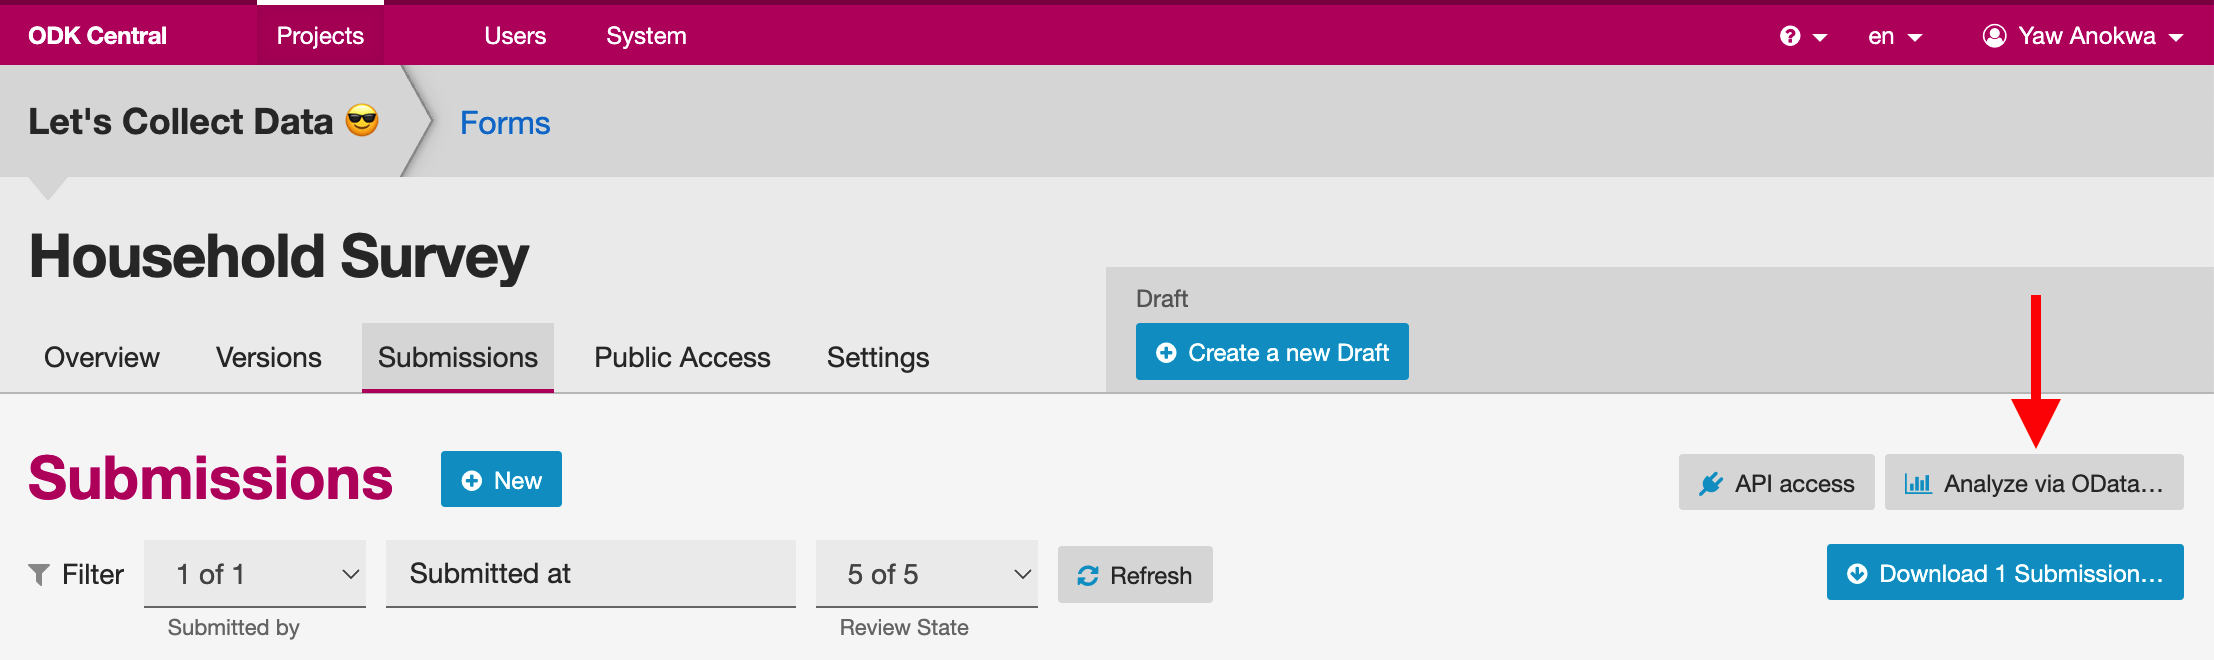
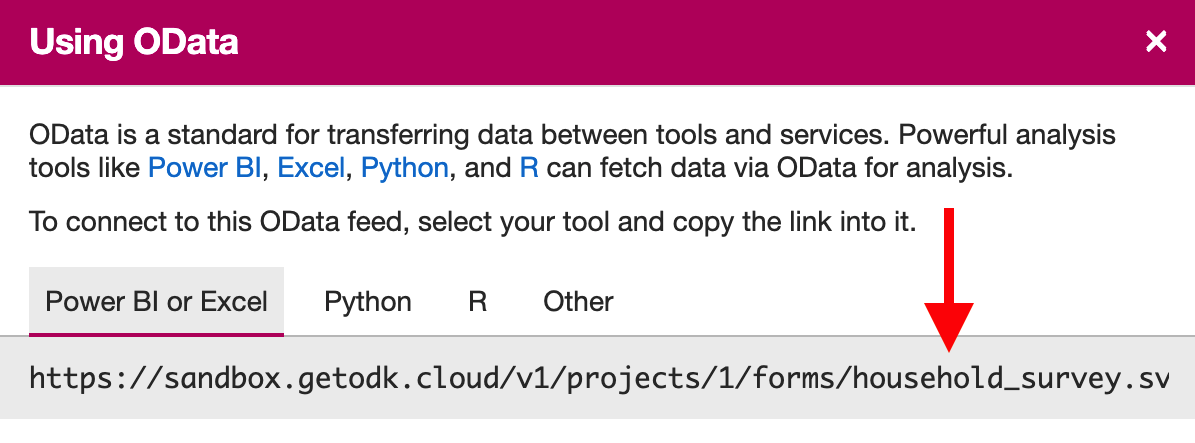
Once you click the button, you will see a popup. Copy the link starting with https.
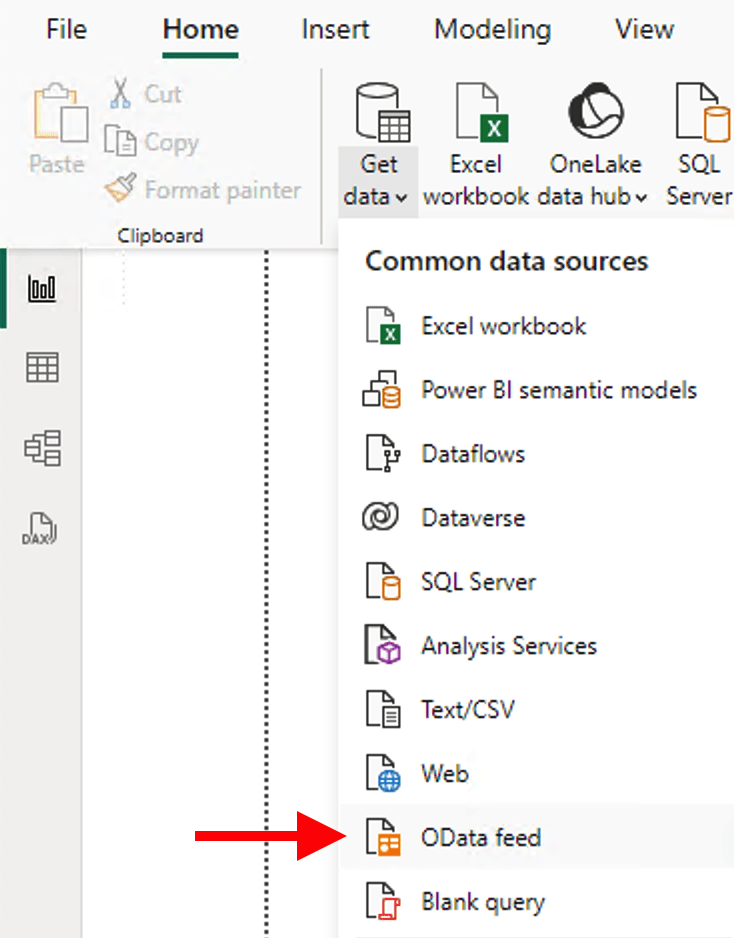
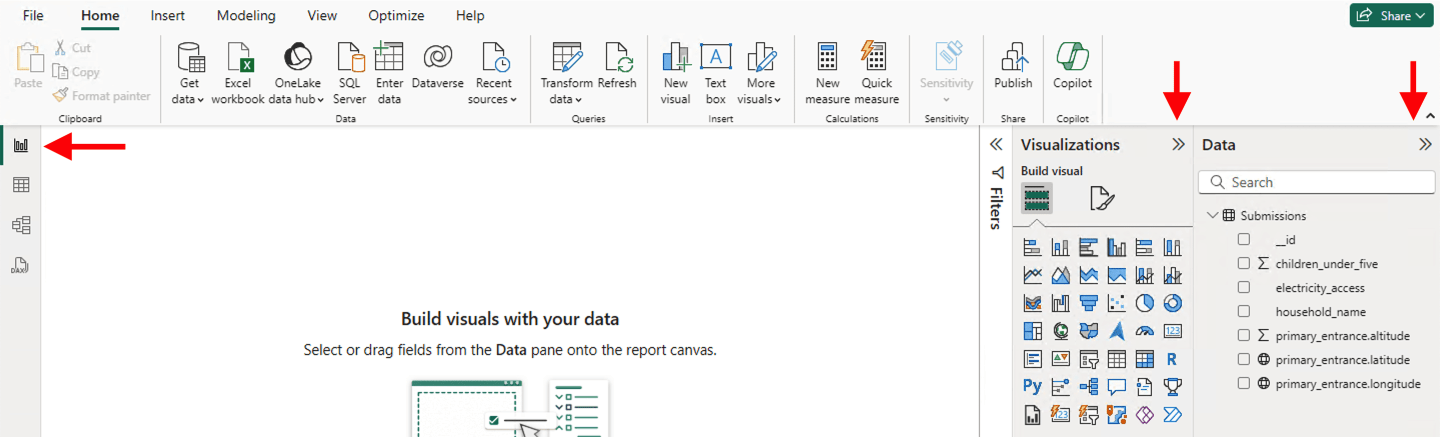
In Power BI, create a Blank report.
Select the Home menu, Get data, then OData feed.
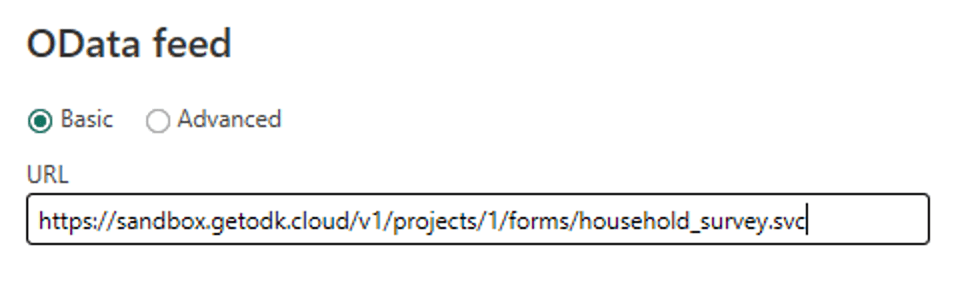
Leave the feed type as Basic (not Advanced), copy and paste in the link from Central, then select OK.
Change the authentication type to Basic (not Anonymous), enter your Central email address and password, then Connect.
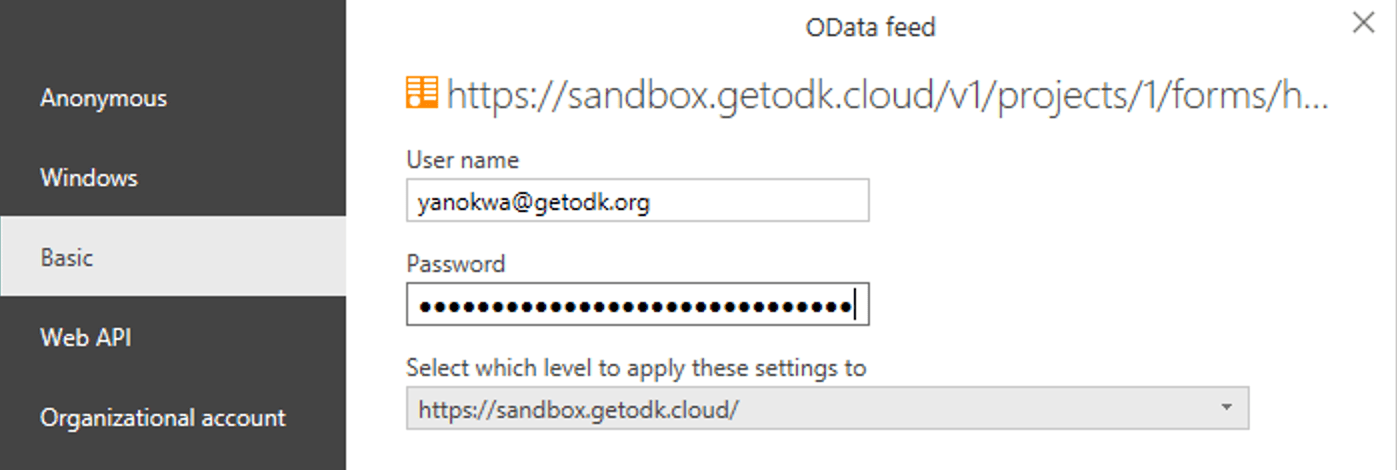
The Navigator window will now appear. Select Submissions, then Transform Data.
Tip
If you are having trouble getting Power BI to connect, and especially if you see error messages about permissions or authentication, clear your cached permissions and try again.
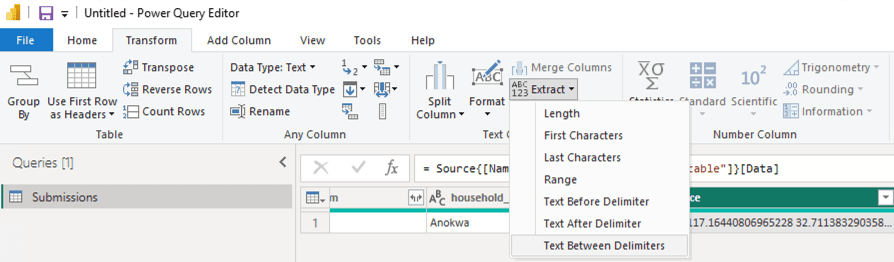
Prepare data for mapping
Power BI doesn't understand OData locations, so we have to prepare the data before mapping.
Select your primary_entrance column.
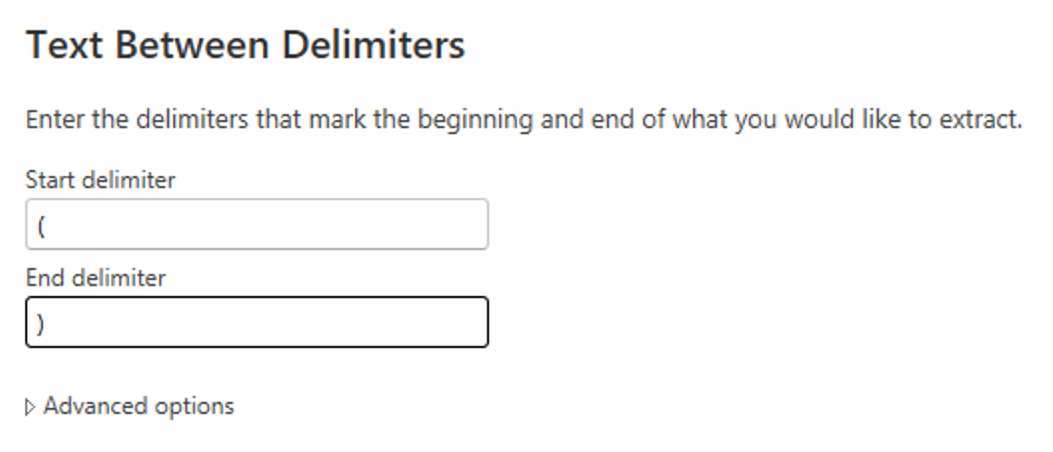
In the Transform menu, select Extract, then Text Between Delimiters.
Use ( as the start delimiter and ) as the end delimiter then select OK.
In the Transform menu, select Split Column, then By Delimiter.
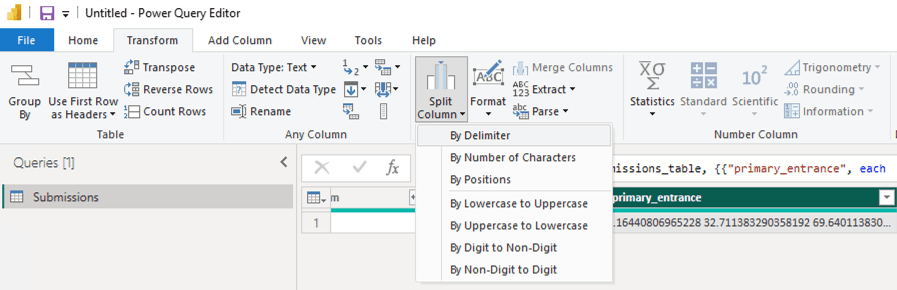
Use Space as the delimiter then select OK.
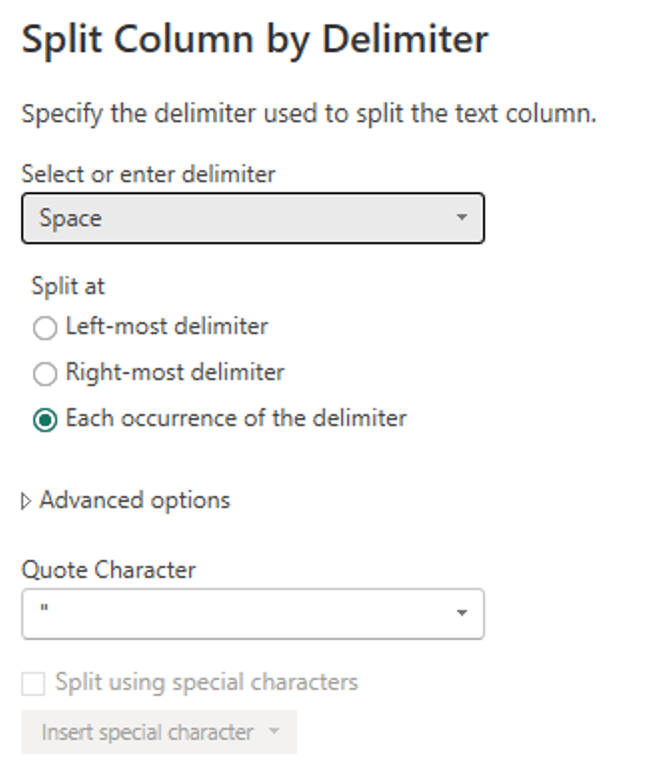
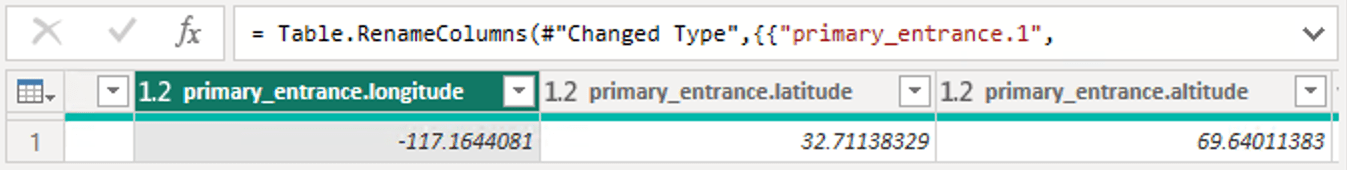
You will now have three columns" primary_entrance.1, primary_entrance.2, primary_entrance.3. Right-click each column and rename them accordingly:
primary_entrance.1 -> primary_entrance.longitude
primary_entrance.2 -> primary_entrance.latitude
primary_entrance.3 -> primary_entrance.altitude
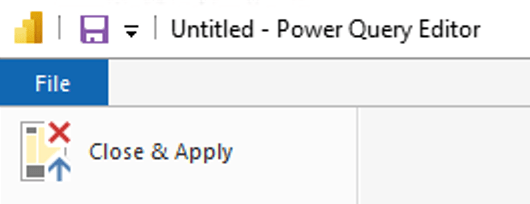
In the File menu, select Close and Apply.
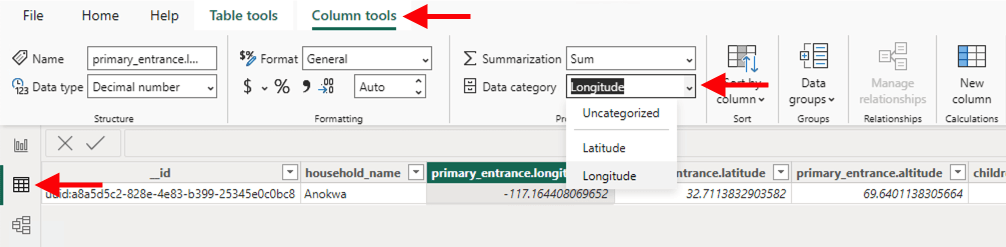
Switch to Table View, select Column tools, then set the Data category accordingly:
primary_entrance.longitude to Longitude
primary_entrance.latitude to Latitude
Display data on the map
Switch to Report view and make sure you can see your Visualizations and Data panes.
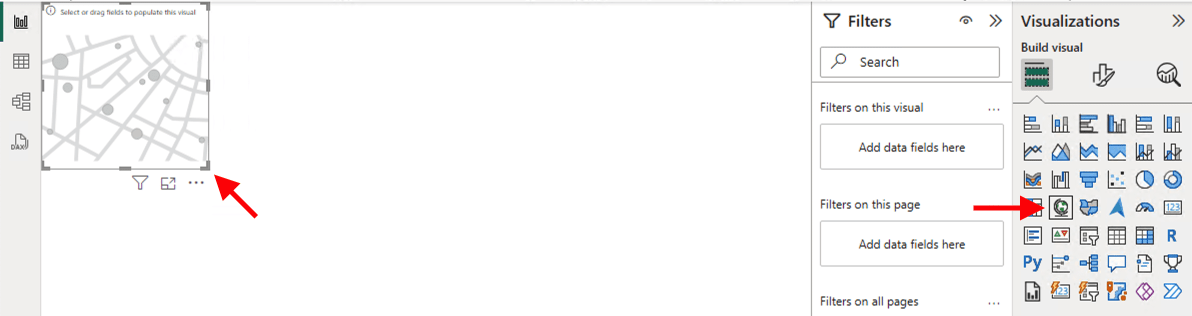
Select Map, and drag the visualization's bottom-left corner to fill the screen.
Drag primary_entrance.latitude from the Data pane to the Latitude section of the Visualization pane. Do the same for primary_entrance.longitude.
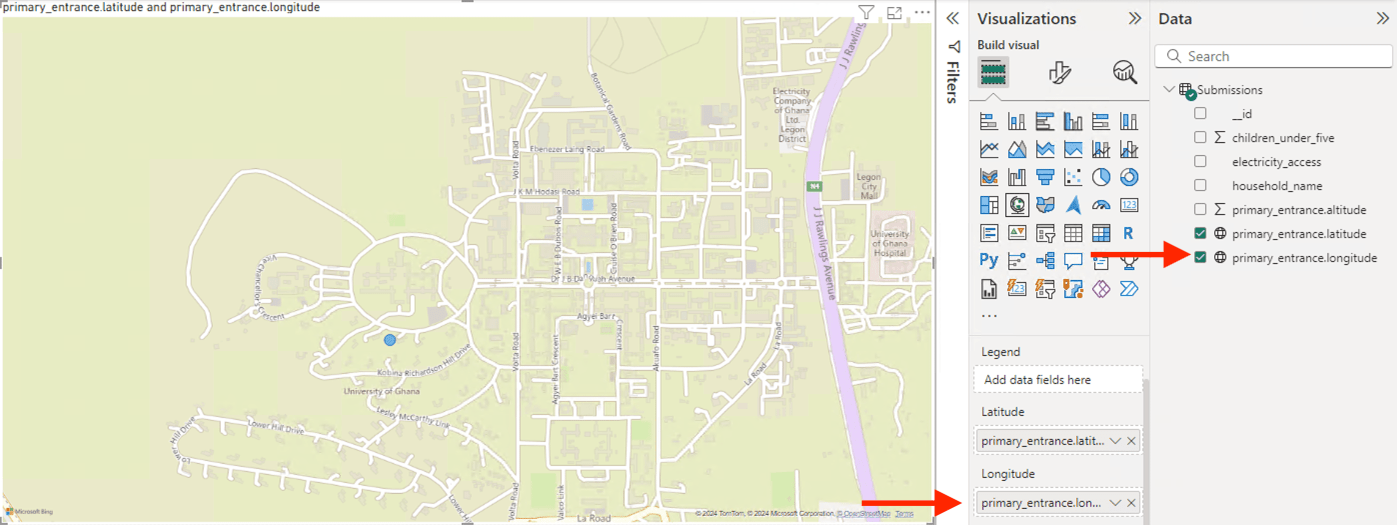
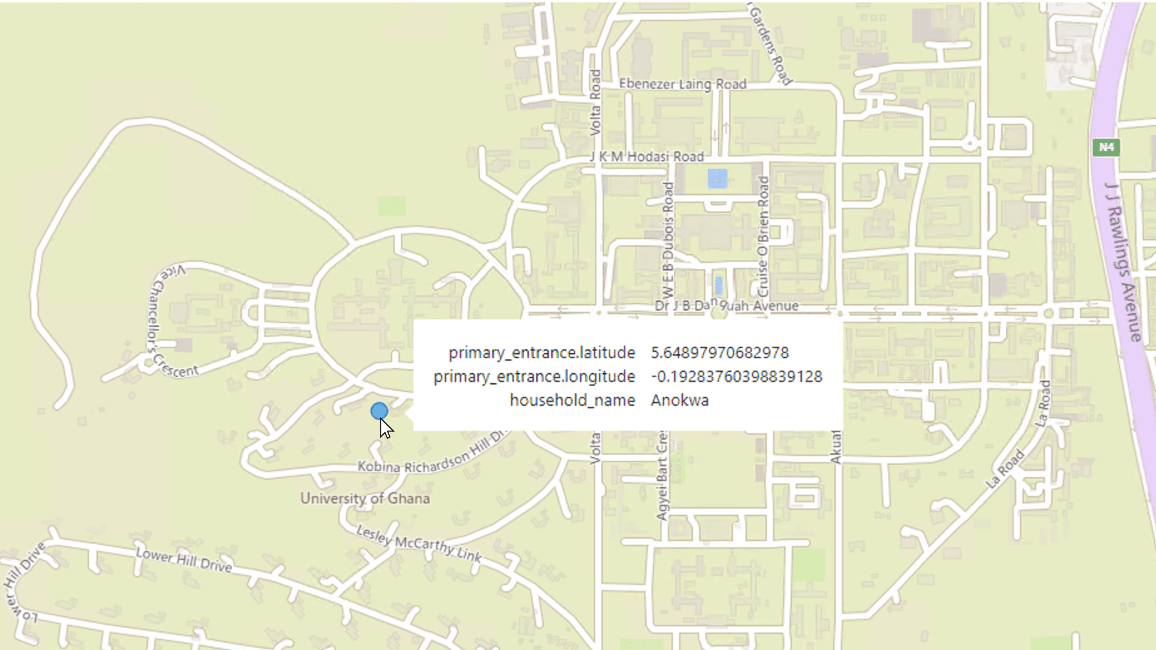
Drag household_name from the Data pane to the Tooltips section of the Visualization pane. It will show up as First household_name. Rename to just household_name.
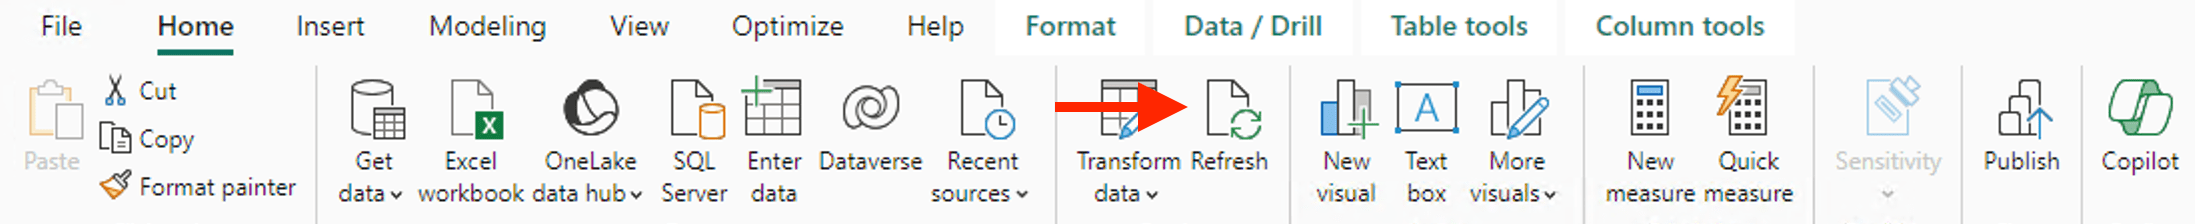
Now, as new submissions arrive, you can select Home, then Refresh to get the latest data.
You can now mouseover each submission to see household_name and primary_location. Enjoy your map!
Your turn
Can you change the color of the point based on electricity_access?
Can you filter to only show approved submissions in the last 10 days?
Can you add another page with household_name on the X-axis and children_under_five on the Y?